
This page describes my recently installed Blitzortung lightning sensing station. It is a Blue Mini, aka a Blue Basic, which I recently purchased from sources in Europe and assembled and placed into service. You can read about the Blue Mini here. It has two H-field antennas, meaning that it detects magnetic fields (not electrical fields) from lightning strikes. It can detect and locate lightning strikes that are thousands of miles away as well as lightning strikes that are nearby.
Why this is interesting? Worldwide there are about eight million lightning strikes per day, or about 100 lightning strikes per second. There is a way that you can see nearly all of these lightning strikes in real time, on a live map. How is such a service possible? There is no government service anywhere in the world that provides such information. This service is provided by a group of volunteers. The service has sometimes been helpful in the effort to pinpoint lightning strikes that have caused wildfires. The volunteers, some of whom are ham radio operators, host a worldwide network of around 1100 active VLF (very low frequency) radio wave receiver stations in 83 countries.
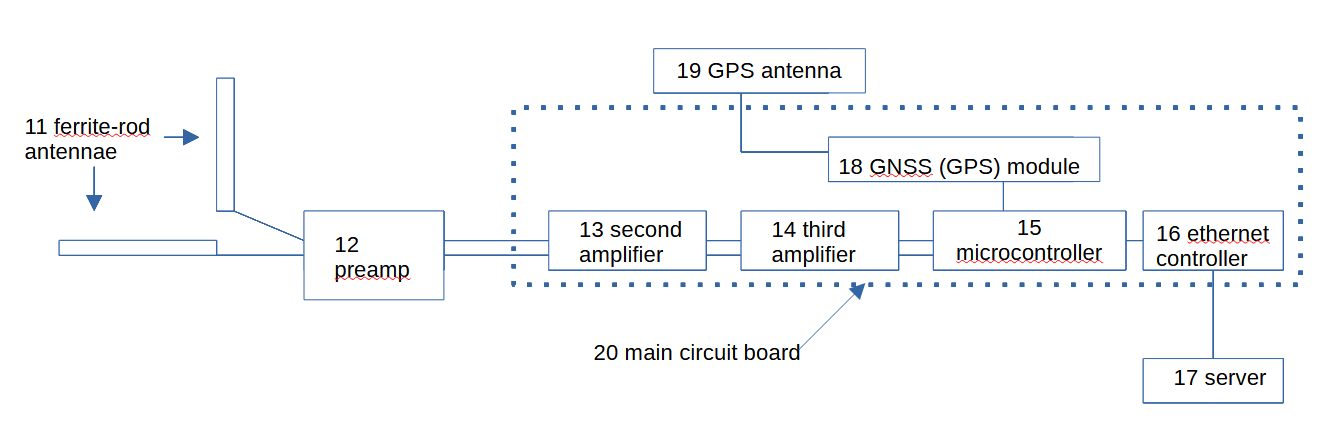
Functional block diagram. At right you can see a functional block diagram for this station. The starting point is two ferrite-rod antennas 11. The antennas 11 detect H fields (magnetic RF energy) from many sources. (Hopefully the main thing they detect is lightning strikes.) The antennas 11 are connected to a two-channel preamplifier 12. The antennas 11 are intentionally not in a high-Q configuration, meaning they are not tuned to any particular narrow frequency or wavelength. The antennas 11 intentionally receive across a wide band running from about 3 kHz to about 30 kHz. This band is sometimes called VLF (very low frequency).
The analog signals from the preamp 12 pass to a main circuit board 20. Within the main circuit board 20 the analog signals pass through a pair of second amplifiers 13, each of which is a two-channel programmable amplifier. From there the analog signals pass through a pair of third amplifiers 14, each of which is also a two-channel programmable amplifier.
From there the analog signals pass to a microcontroller 15. The microcontroller 15 relies upon an ultraprecise clock signal from global navigation satellite system (GNSS) module 18. The GNSS module 18 also provides position information. The GNSS module 18 relies upon a patch GPS antenna 19. The microcontroller 15 uses an ethernet controller 16 to communicate with the internet. In this way the Blitzortung station communicates with a server 17.
Sending reports to the server 17. The microcontroller 15 observes a “noise floor” in the two antenna signal paths, typically around 18-25 mV (millivolts). The microcontroller 15 is configured with a threshold or “trigger”, typically around 50-80 mV. When the trigger happens, the microcontroller 15 generates a signal report to send to the server 17.
It is commonplace for the station to send around one hundred thousand reports per day to the server 17. This works out to an average of about one report per second.
Each report of a lightning strike from a station contains information about the precise location of the station that received the signal, and the ultraprecise time of arrival at the station of the electromagnetic pulse from the lightning strike. (The location is accurate to within a few tens of meters, and the time is accurate to within a few tens of nanoseconds.) The server 17 draws upon reports from about 1100 stations around the world. For any particular lightning strike, the server 17 collects reports from several dozen stations. (These are called “involved” reports.) The server 17 uses the time-of-arrival information from about twelve of the collected (“involved”) reports to triangulate very accurately the location of the lightning strike. (These are called “used” reports.)
It will thus be appreciated that no single detection station actually works out the location of a lightning strike by itself. It is the server 17 that works out the location of the strike, drawing upon information from many detection stations.
Selecting an antenna type. A would-be operator of a lightning strike detection station faces several preliminary decisions. A first decision is whether to try to detect the electrical component of the signal from the lightning strike on the one hand (called “E-field”), or the magnetic component on the other hand (called “H-field”). The way it works out is that from a lightning strike, most of the E-field propagates with a vertical orientation (relative to the surface of the Earth) and most of the H-field propagates with a horizontal orientation.
Antenna count. If an E-field antenna is to be used for detecting lightning strikes, one antenna suffices. A single vertical antenna can pick up E-fields from lightning strikes arriving from any and all directions. In contrast, if the signal to be detected is the H-field, two antennas are needed as will be discussed below.
The wavelengths being detected are on the order of 10 to 100 kilometers (approximately 6 to 62 miles). The traditional approach to detecting E-field signals is a wire antenna (perhaps a monopole) having a physical length that is within an order of magnitude of the wavelength of the signal. As mentioned above, the E-field signal from a lightning strike tends to be mostly vertically oriented. A moment’s reflection reveals that it is not a realistic goal to construct (for example) a vertical monopole antenna with a length (height) of some miles. It turns out that a vertical monopole antenna at human scale (for example 10 cm or 4 inches in length) is able to receive usable E-field signals from lightning strikes. The antenna needs to be well off the ground, away from sources of EMI (electromagnetic interference), and there is no choice but to consider how to protect the antenna and its preamplifier and analog signal path from damage from a lightning strike or other ESD (electrostatic discharge).
These challenges for E-field detection of lightning strikes help to explain why the most recent generation of Blitzortung station does not provide a signal channel for E-fields but instead provides only signal channels for H-fields. My “blue mini” station has two H-field signal channels and no E-field signal channel. For the wavelengths involved here, an H-field antenna does not need to be high off the ground, and does not even need to be above ground. It could just as well be in a basement or crawl space given that almost nothing can meaningfully attenuate the H-field signal.
We say “antennas” in the plural because the antenna will be quite directional in its reception. As mentioned above the H-field signal from a lightning strike tends to propagate mostly horizontally. This means that the H-field antenna needs to be oriented with its axis more or less in a plane parallel with the surface of the earth. Given that the antenna has an axis, then what is needed is two antennas, oriented approximately orthogonal with each other.
Having settled upon H-field as the kind of signal to detect, this then presents to the would-be station operator the question of what kind of H-field antennas to use. One option is to construct loop antennas. The operator would construct two loop antennas by hand, each perhaps having around twenty turns of copper wire in a loop with a diameter of around 38 cm (15 inches). The loop-antenna approach has the advantage that the construction materials can be very inexpensive. But the resulting antennas are of some size and you would have to think about where to place the antennas and, if they are outdoors, how to protect them from physical harm and from the elements. (There is a helpful discussion of types of VLF antennas here.) It is very easy for the maker of a loop antenna to inadvertently do the work in ways that yield unpredictable variations in electrical characteristics.
The other commonly employed type of H-field antenna for VLF reception is the ferrite-rod antenna (“FRA’). I chose this path for several reasons. One thing is that the FRA is physically compact in size (20 cm in length or around 8 inches) compared with the much larger size of a loop antenna. There is a provider of FRAs (mentioned below) that makes FRAs that are ideally suited to use for Blitzortung stations, which meant that I would not need to try to construct my own loop antennas.
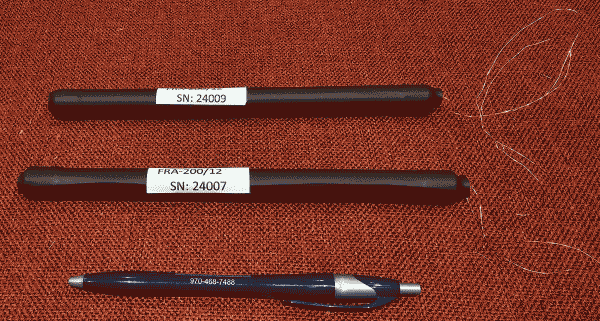
Ferrite-rod antennas 11. At right you may see the two ferrite-rod antennas 11 as they came out of the box from Europe. Each antenna is about 20 cm long. I got them from Ferrite Rod Antennas. The maker says that each of the antennas resonates at 130 kHz and has an inductance of about 15.2 mH.
Detail of the FRAs. The maker of the FRA tells me that he starts with the ferrite rod and then protects it with a layer of heat-shrink tubing (“HST”). The HST helps to protect and strengthen the ferrite rod, which is otherwise quite brittle. He then wraps many turns of fine-gauge copper wire onto the rod, one layer thick, along nearly the entire length of the rod. He then places another layer of HST around the winding. The result is a fairly robust antenna that has a small form factor and very predictable electrical characteristics. The chief aspect of an FRA requiring some care is that the wire leads are extremely thin and could easily be broken. It is desirable to secure the FRAs and preamp to provide strain relief, as discussed below.
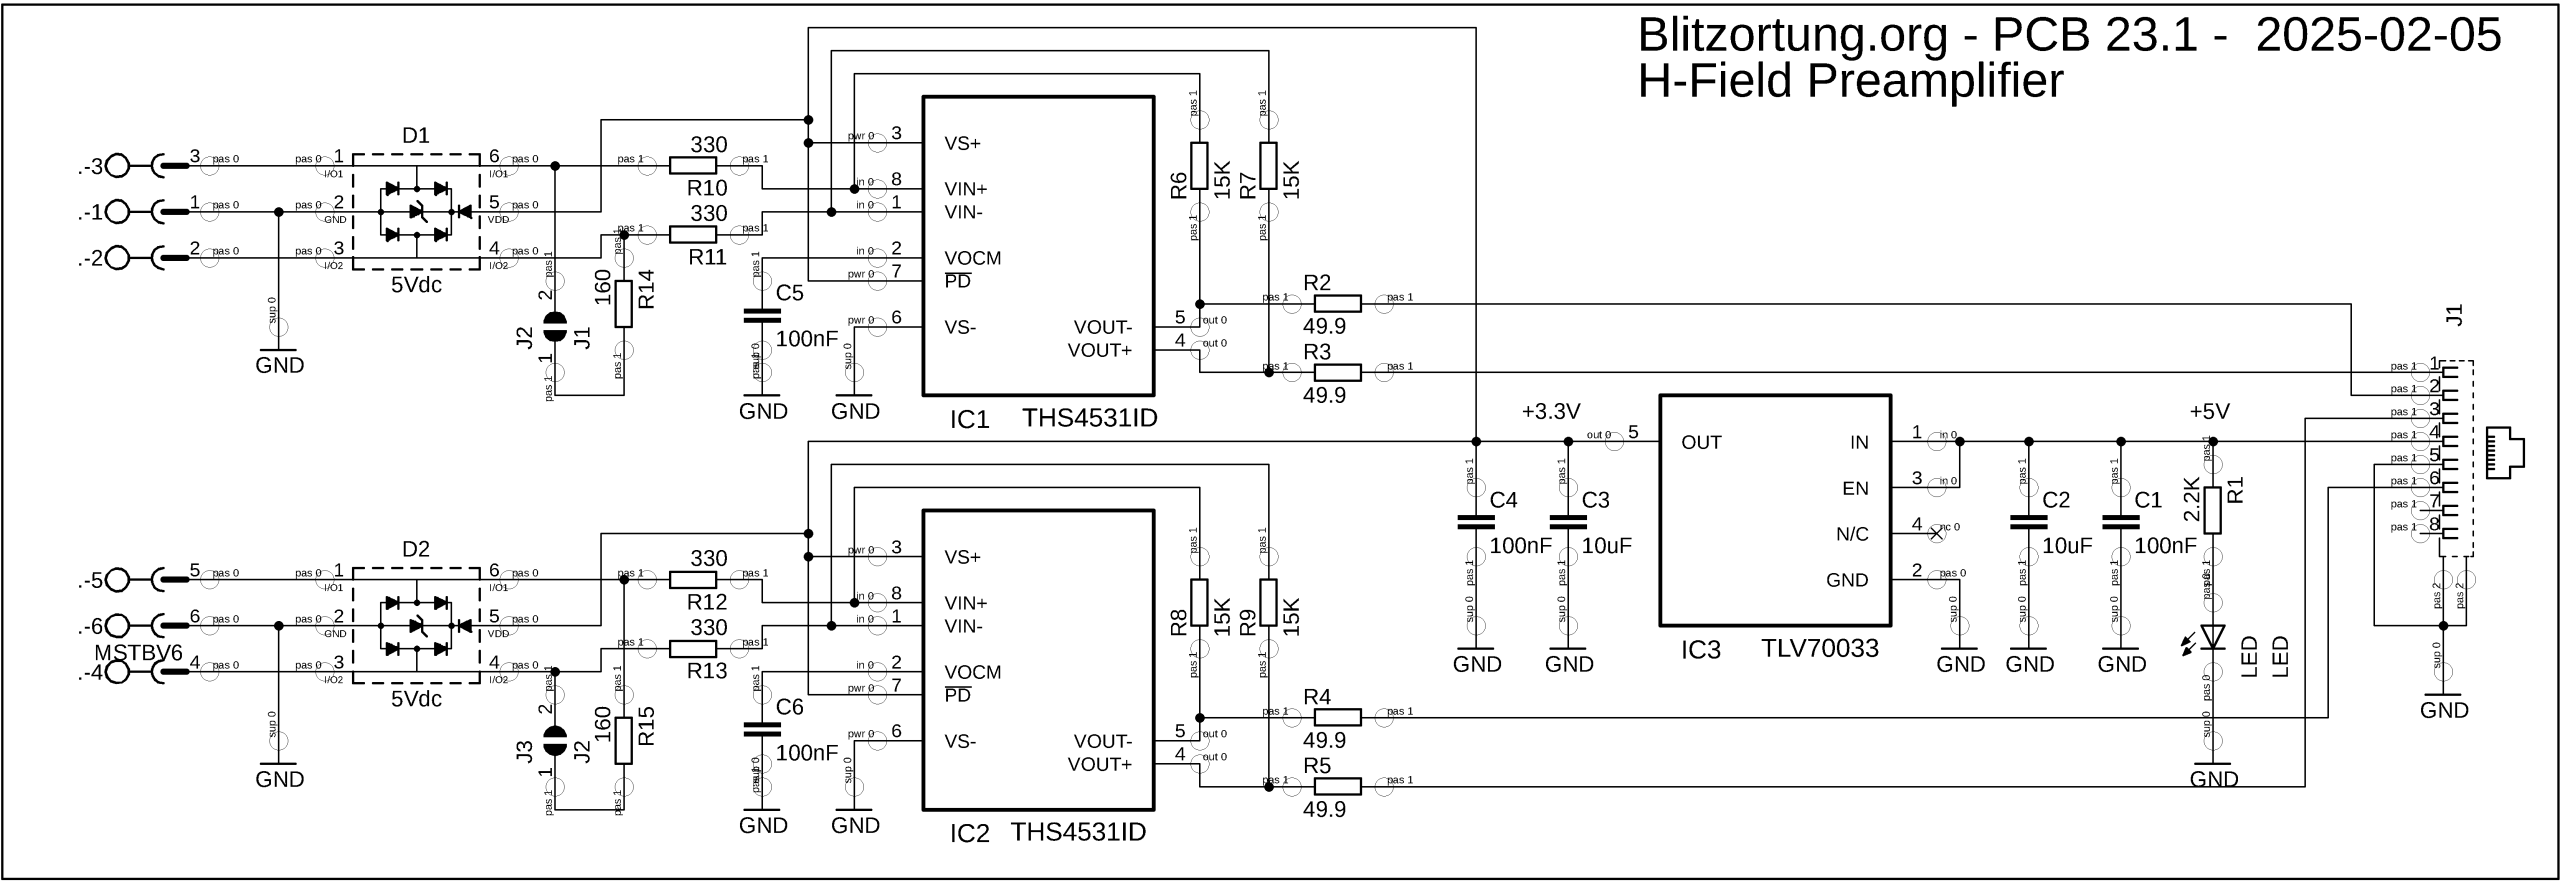
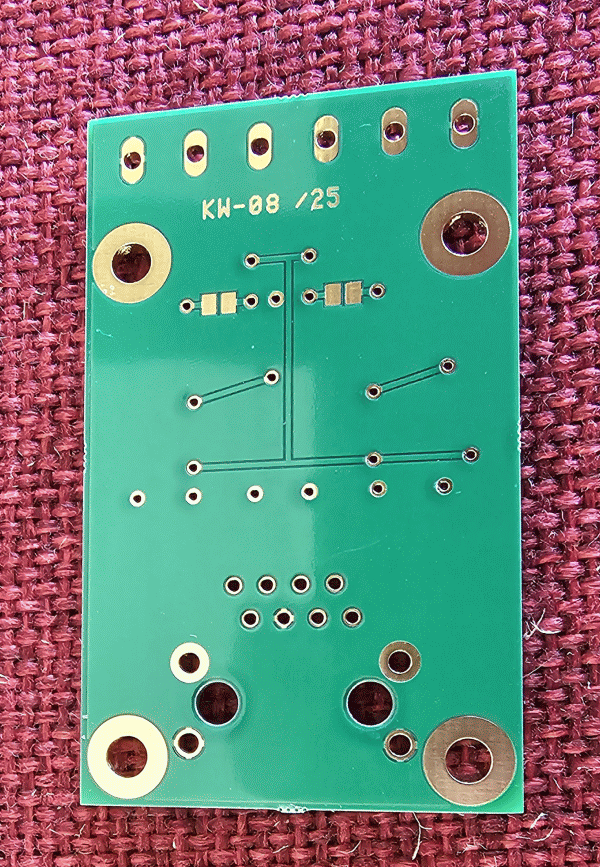
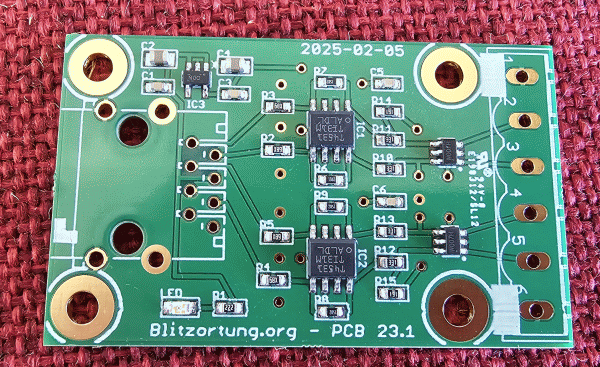
Preamplifier 12. The preamplifier 12 is a version 23.1 circuit board (schematic at right). At right you can see a top view and bottom view of the circuit board. All of the surface-mount components were already attached when I received it.
The op amps on the preamplifier board 12 are TI THS4531A devices (spec sheet). As you can see from the schematic, the circuit is designed to provide a fixed gain of about 45. The op amps are protected from ESD (electrostatic discharge) by Würth Elektronik 82400102 ESD protection diodes (spec sheet).
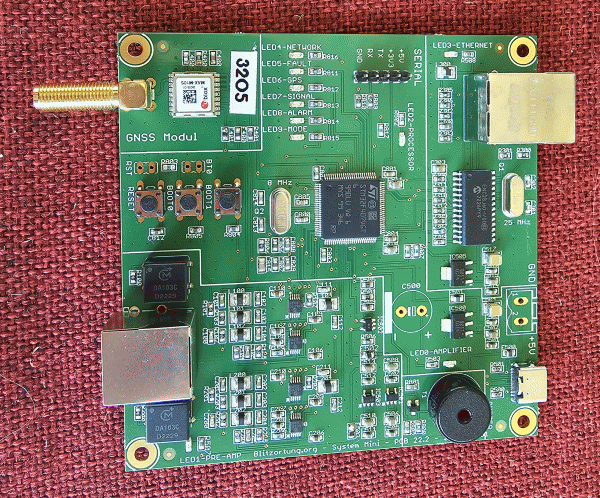
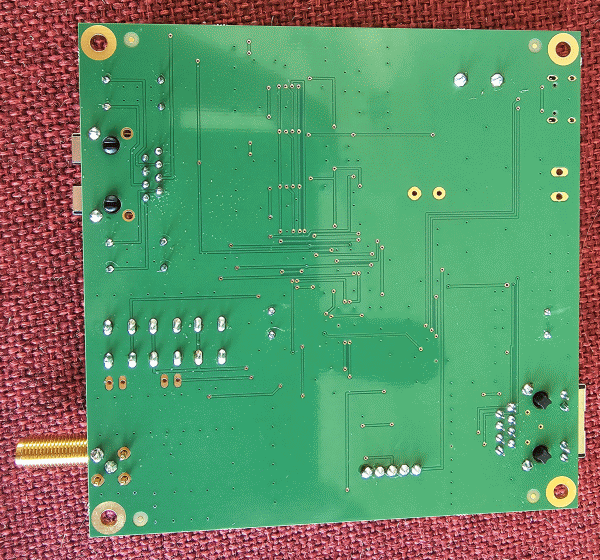
Main board 20. The main board 20 is a version 22.2 circuit board (PDF schematic). The firmware says the board has an ID of “8/4”. At right you can see a top view and bottom view of the circuit board 20. All of the surface-mount components were already attached when I received it. The main board 20 arrived with firmware version 10.1. I have since upgraded the firmware to a beta-test version 11.0b3.
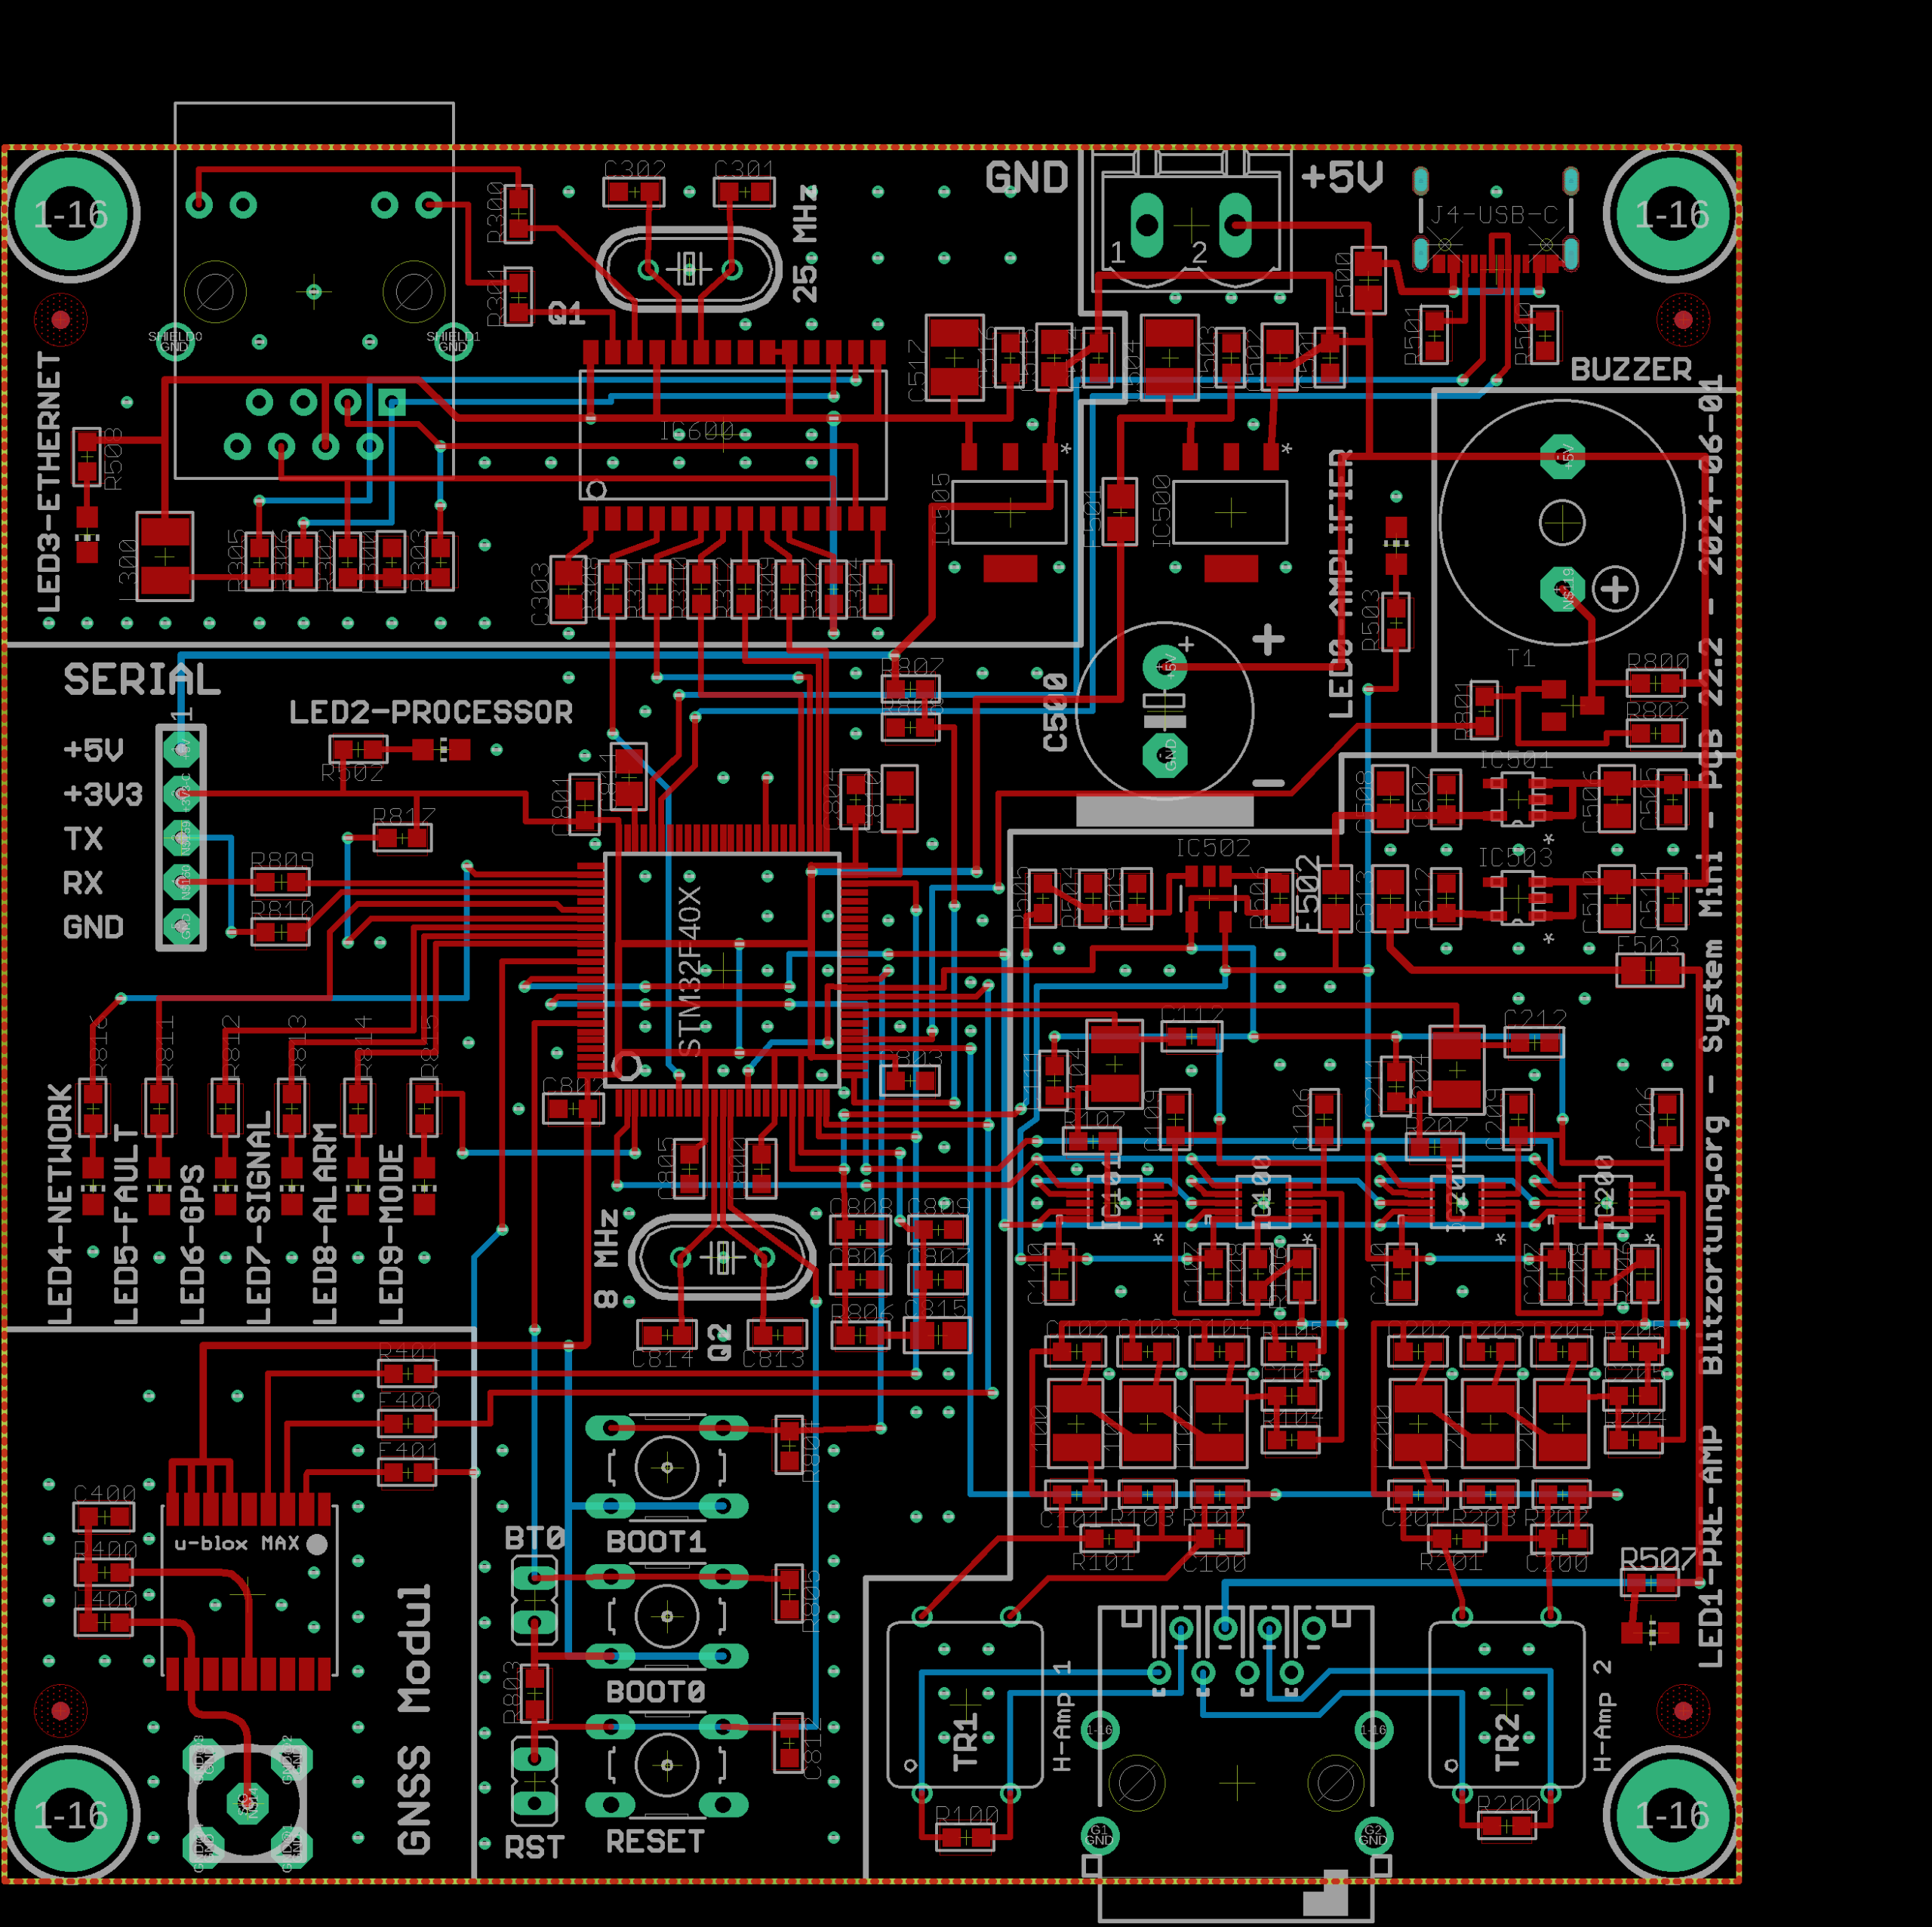
At right you can see the PC board layout. Here is the parts list.
Per the parts list, the microcontroller 15 is an STM32F40X processor (spec sheet). The firmware says that the microcontroller 15 is STM32F405/407 Rev. 5/6. The marking on the chip is STM32F407VG.
Each of the two analog signal paths has two programmable-gain amplifiers 13 and 14. They are Microchip MCP6S91 devices (spec sheet). A typical setting for the first of these amplifiers 13 is a gain of 8, and a typical setting for the second of these amplifiers 14 is a gain of 4. This works out to a typical overall gain of 1280.
The ethernet controller 16 is a Microchip ENC28J60 device (spec sheet). It operates at 10 Mbps. It defaults to half-duplex mode but I have set it to full-duplex mode.
The GNSS (GPS) module 18 is a u-blox MAX-M10 device (spec sheet). It is able to detect signals from four sets of global navigation satellites:
-
- GPS (United States)
- Galileo (Europe)
- Glonass (Russia)
- Beidou (China)
At present, I have the GNSS module configured to make use of three of the systems — GPS, Galileo, and Glonass.
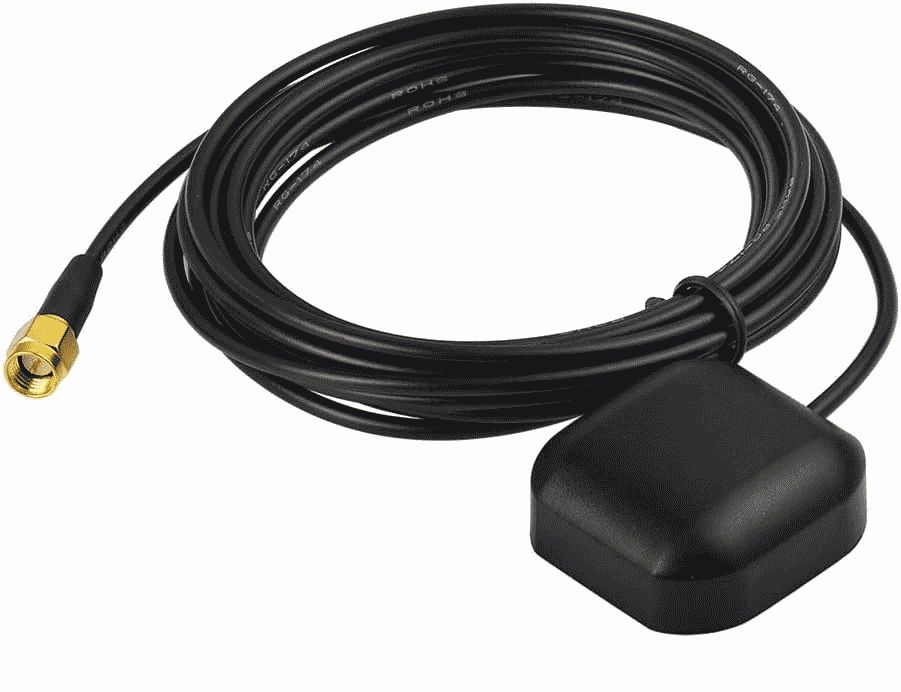
The station requires a GPS antenna 19. I used a Bingfu antenna (seen at right) costing $9. The circuit board 20 has an SMA female connector, so the antenna 19 has an SMA male connector.
The GNSS module, together with this antenna, routinely achieves dilution-of-precision values of less than unity (where smaller values are better). It is able to determine the precise time of day to within a few tens of nanoseconds.
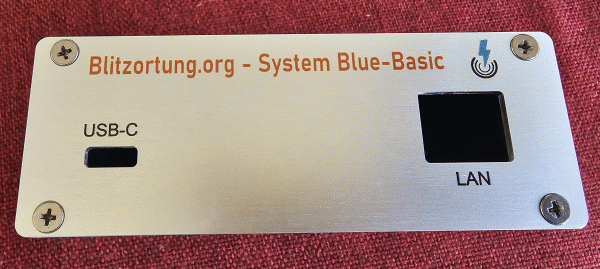
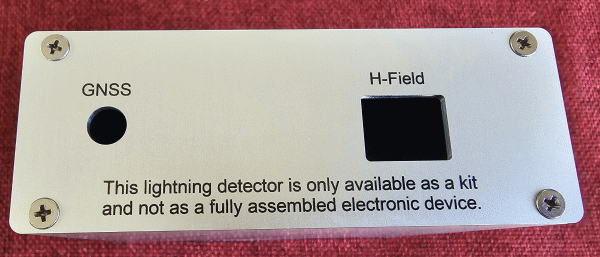
The main board 20 lives in an aluminum case. At right you can see its front panel and rear panel. The front panel has a power connection (“USB-C”) and an ethernet connection (“LAN”). The rear panel has a connection for the GPS antenna (“GNSS”) 19 and a connection (“H-Field”) for a cable to the preamp 12.
In the Blitzortung system, each lightning detection station has a “station number”. This station was preconfigured to have station number 3205. The station was first powered up on August 4, 2025. You can see the system status here.
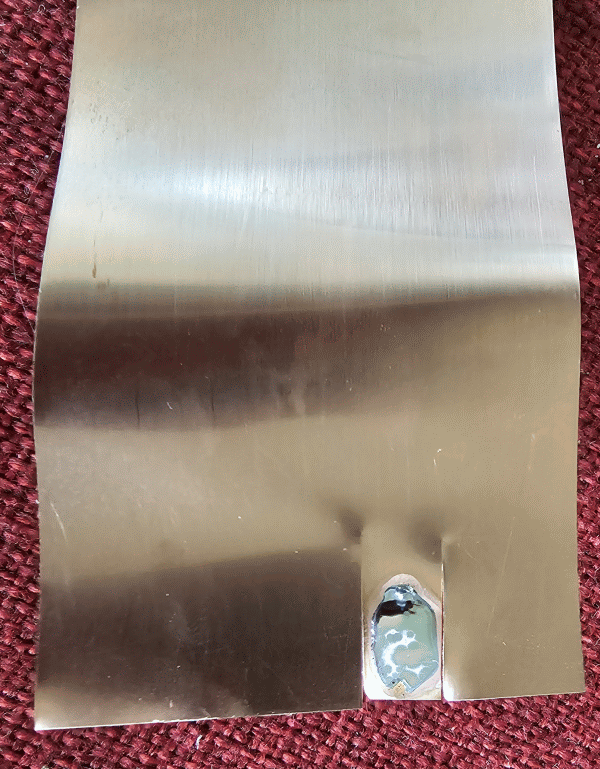
Antenna shielding. I have shielded both of the antennas with copper foil that is about 0.1 mm thick. You can see a trick I used for soldering the shielding foil — two slits to make it easier to tin the foil.
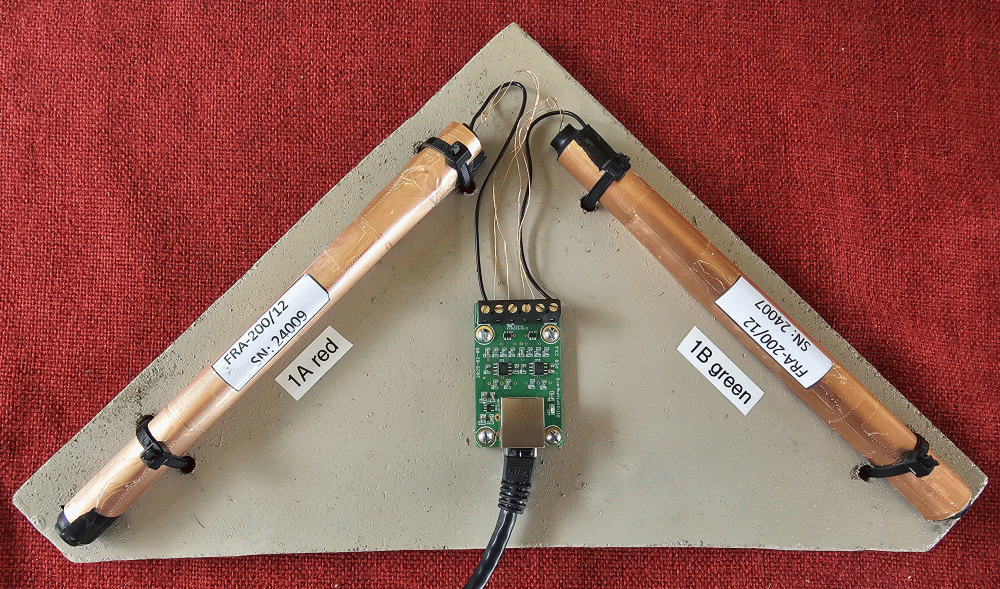
Antenna mounting. I mounted the antennas 11 and the preamp 12 onto a triangular wooden board, shown at right. The main purpose of this board is to provide strain relief for the very delicate electrical leads from the antennas. The board also provides a fixed orthogonal orientation of the two antennas. You can see the copper shielding on the antennas. The antennas are labeled 1A and 1B to indicate their designations in the firmware and in the user interface.
Antenna orientation. When installing a lightning detection station that uses H-field antennas, it is desirable for the antennas to be approximately within a plane parallel to the surface of the earth. There is no need for the antennas to be oriented any particular direction (such as north-south and east-west); it is enough that the antennas are approximately orthogonal to each other.
Antenna phasing. The maker of the FRAs chooses to indicate the phase of the antenna by providing a small knot in one of the copper wires emerging from the antenna. For some applications such as RDF (radio direction finding), one might feel the need to keep track of phasing. But given that the only analysis being carried out here is time-of-arrival of the signal from the lightning strike, there is no need to keep track of phasing. So I did not pay attention to the knot on one of the wires.

System location. A chief goal when setting up a lightning detection station is to pick a location that has relatively little radio frequency interference (RFI). On August 19, 2025 I relocated the station from an indoors location that was relatively noisy (in terms of RFI) to a relatively RFI-quiet location. The location I selected (seen at right) is a pumphouse located around 40 meters (around 120 feet) away from any building. This pumphouse is served by buried cables providing electrical power and ethernet.
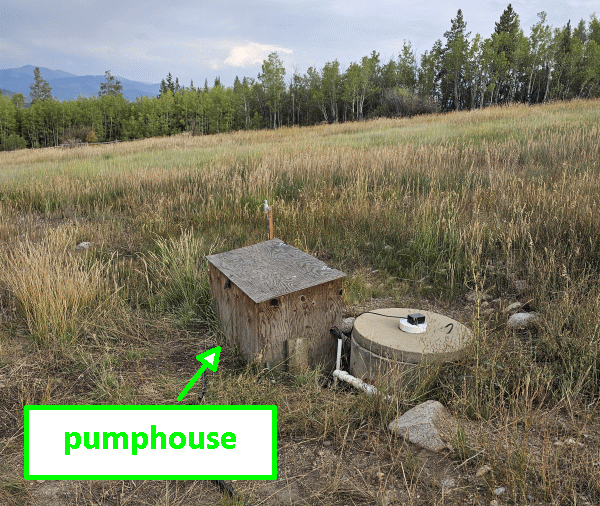
Here you can see a closer view of the pumphouse. Its roof is hinged and serves as a lid. The lid can be opened for access to the pump and to other things that are inside the pumphouse.
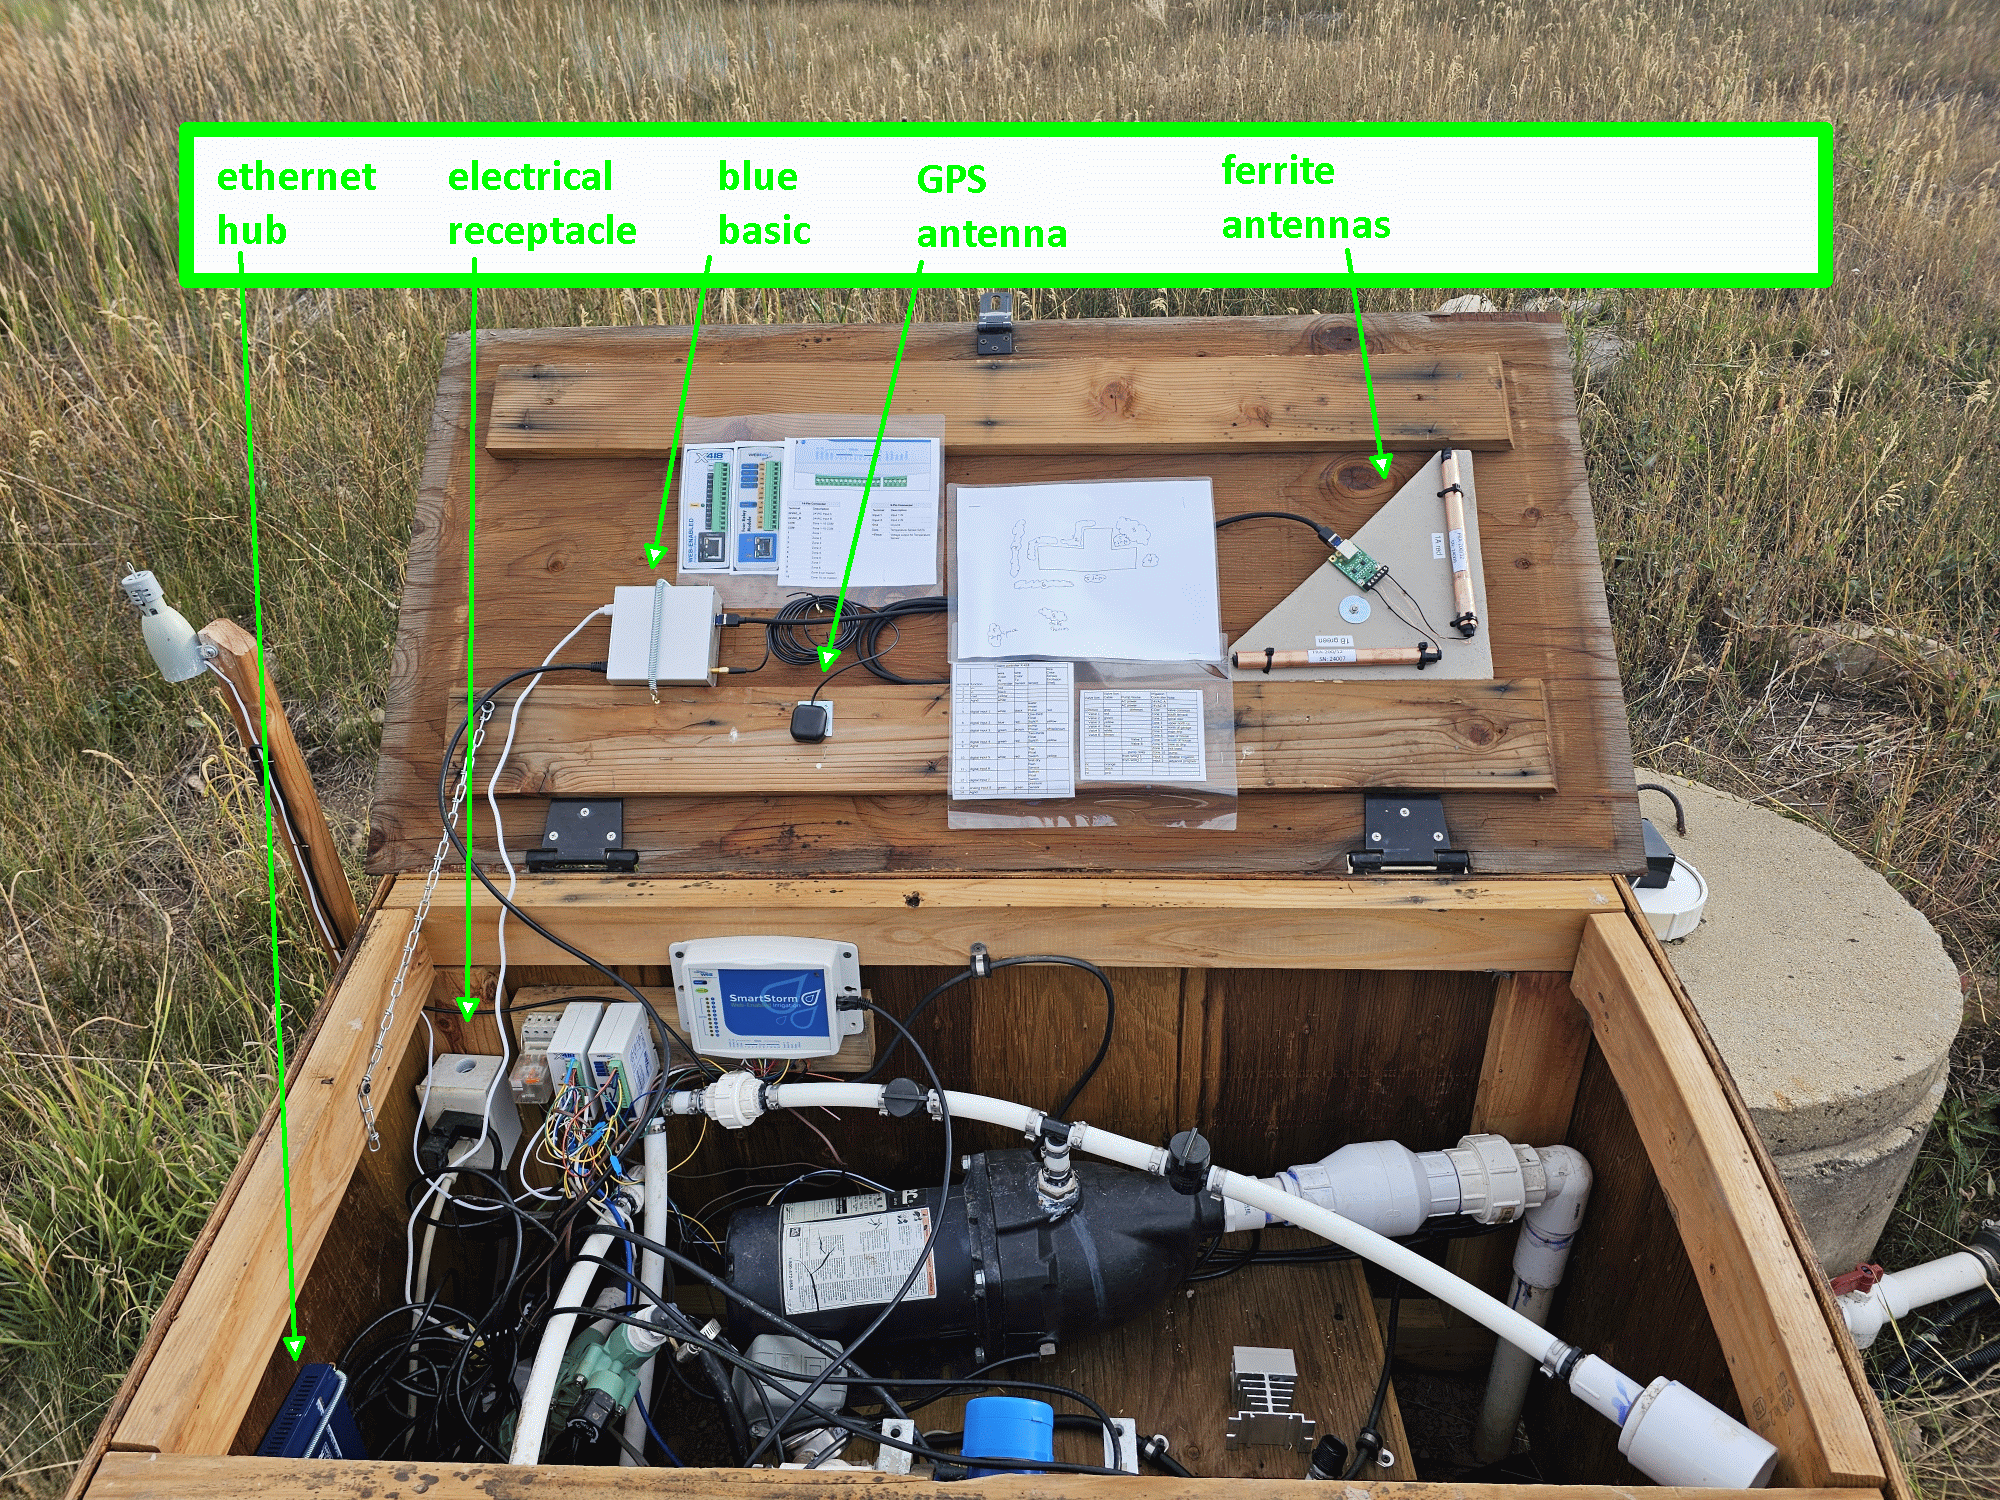
At the pumphouse, I chose to mount the blue mini 20 and the GPS antenna 19 and the ferrite-rod antenna board to the underside of the lid. You can see this in the photo at right.
The main purpose of the pumphouse is, oddly enough, to house a pump. The pump is a jet pump which draws water from a nearby cistern and feeds it to an irrigation system. The pump is powered by a ¾-horsepower electric motor.
It might be thought that this motor would generate RFI. And indeed when the motor operates (which, fortunately, is not very often), the motor does raise the noise floor for the H-field analog signal path. When the pump is not running, the average noise in each of the two analog channels is around 15 mV. When the pump is running, one channel often rises to around 19 mV and the other often rises to around 50 mV.
Firmware. The new beta-test firmware (version 11.0b3) for this blue mini has an “auto adapt to noise” feature that very nicely handles the few minutes of each day that the pump is on. I have posted a Youtube video showing this nice feature in action.
Seeing the results. All of the Blitzortung stations in the world are listed here. The station list is 67 pages long, and each page lists 100 stations. This might make you think that there are at least 6601 stations, but that is not so, because most stations are set in two or more “regions”, and the station will show up in the list once for each “region” in which it is set. The actual number of active stations in the world is about 1100, and the actual number of active stations in North America is about 250.
For each station, four numbers get reported:
-
- Total. This is the total number of signal reports that this station sent to the server 17 in a measurement period (I think it is the past hour).
- Valid. This is the number of signal reports from the station that the server 17 deemed to be “valid”, meaning “not noise”.
- Involved. This is the number of signal reports from the station that were not only deemed “valid” but that the server chose to draw upon in trying to determine the location of the strike. This means the station was included in the relatively exclusive group of a few dozen stations whose reports got used for the initial analysis of a lightning strike.
- Used. This is the number of “involved” signal reports from the station that actually got “used” to determine the location of the strike. This means the station was included in the very exclusive group of a twelve stations whose reports got used for the pinpoint location of a lightning strike.
All four of these numbers are, of course, of potential interest to a station owner. Bigger is generally better for most of these numbers. But by far the prize is to rank highly on the “used” column.
The default sort order is “descending by ‘used'”, which I think for most people is probably the most interesting sort order. In this sort order, the first-listed stations are the ones that tend to send good reports of actual lightning strikes to the server 17 and that tend to avoid sending “noise” reports. Part of how a station owner can learn whether his or her station is working well is by looking to see how high the station turns up in this “descending by ‘used'” report.
You can see my station in this list. A good way to see my station is to select “North America 2” as the region and check the box for “current only”. Leave the “Stations” field set to the default asterisk, and click “ok”. You will get three pages of search results, again each page listing 100 stations. I am pleased to report that my station 3205 (listed as “Summit County” with a comment of “AA2KW blue basic”), is very often on the first page among the three pages, and is very often within the first thirty or so listings among the 100 listings on that first page.
The persistent reader can repeat this filter, changing the region to “North America 1”, and again perhaps my station will turn up on the first page, and might be among the first thirty or so listings on that first page.
The even more persistent reader can repeat this filter again, this changing the region to “United States / Colorado”. The six active stations in Colorado will be listed.
Station-specific statistics. Now we can return to the station statistics web page for my station 3205. On this web page you see eight graphs. The first graph shows a typical lightning strike report, with the electromagnetic pulse appearing in the center at 500 μs. The second and third graphs show typical noise spectra for each of the two ferrite-rod antennas 11. As you can see, most of the received energy for each analog channel is below about 80 kHz. The fourth, fifth, sixth and seventh graphs show four weeks of historical information about the performance of the station. The eighth graph is populated with vertical blue bars, one bar for each of the most recent 28 days. For each day, it reports (on a logarithmic scale) nearest and furthest-away lightning strikes detected by the station. As you can see, in recent days the nearest detected strike was 7 km (about 4 miles) away, and the furthest-away detected strike was 9547 km (about 6000 miles) away.
We now focus on the seventh graph, which shows performance information for this most recent week of station operation. Looking at the legend, we see that for the background of the graph, what one would prefer is that it be gray (and not some other color such as red or blue or black). Blue means “bad GPS” which it seems to me ought never to happen given that my GNSS module and its antenna consistently have a high quality unobstructed view of the entire sky. Red means “interference mode” meaning that the station chose to cease sending signal reports to the server 17, due to a suspicion that most of the reports are “noise”. Black means the station was “offline”, which might mean loss of power or loss of internet connectivity.
Within this seventh graph, our attention is drawn to the four graphed lines, being white, orange, green and blue in color.
The white line is the total number of signal reports received by the server 17 from this station, and one would prefer that this white line not be zero or close to zero.
The orange line is the “valid/total” line. This orange line shows a ratio comparing two things:
-
- the total number of strike reports that the server 17 received from my station (defined above in connection with the white line), and
- the number of my station’s strike reports that the system deemed “valid” (not noise).
One would prefer this orange line to be higher rather than lower. For my station, in recent days this orange line is often in the range of 75-85%.
The green line is the “involved/valid” line. This green line shows a ratio comparing two things:
-
- the number of strike reports from my station that the server 17 deemed to be “valid” (defined above in connection with the orange line), and
- of those, the number of strike reports from my station that the server 17 chose to “involve” in the TOA (time of arrival) triangulation process.
It is recalled that for this “involved” analysis server 17 generally collects reports from about 20-80 stations. So the green line indicates how often my station got included in the somewhat exclusive group of 20-80 stations that had the honor to be “involved” with a particular lightning strike. For my station, in recent days this green line is often in the range of 14-59%.
The blue line is the “used/involved” line. This blue line shows a ratio comparing two things:
-
- the number of strike reports from my station that the server 17 chose to “involve” in the analysis of a strike (defined above in connection with the green line), and
- of those, the number of reports from my station that the server 17 further chose to “use” in the actual final TOA triangulation process.
It is recalled that for this final triangulation calculation, the server 17 generally “uses” reports from 12 stations. So the blue line indicates how often my station got included in the very exclusive group of 12 stations that had the honor to have their report “used” to pinpoint the location of a particular lightning strike. For my station, in recent days this blue line is often in the range of 40-52%.
Conclusion. We thus have at least two ways of seeing how productive my lightning detection station is. A first way is to look at the “station list” to see where my station ranks compared with other stations, in terms of how many signal reports got “used”. My station often ranks favorably in this station list. A second way is to look at the white, orange, green and blue lines in the station report. The orange, green and blue lines suggest that my station is not sending very many “noise” reports to the server 17. This suggests that the reports that my station sends to the server 17 tend to be actual lightning events, and that the reports are often of good enough quality to get “used” in the final determination of the location of lightning strikes.
What are the factors that perhaps help to explain the generally favorable performance of this station? The factors probably include some mix of the following:
-
- The chief factor is surely my good luck in having found a place to put the station that has relatively little RFI (radio frequency interference) in the frequency band of interest (around 3-30 kHz).
- Another important factor is my having turned off the “automatic” configuration mode in the station firmware. The “automatic” mode allows the server 17 to make changes from time to time in the amplifier gain and in the trigger level. The “automatic” mode, in my experience, tends to be too aggressive about increasing amplifier gain and in setting a “trigger” level that is too low. This leads to long stretches of time during which the station goes into an “interference” mode, ceasing all reports to the server 17 due to suspected noise. Instead, I am using “manual” mode in which all decisions about gain and trigger levels are made locally. Furthermore, I am using the beta firmware 11.0b3 which has what I consider to be a well-crafted “Auto Adapt to Noise” feature that makes good choices about gain and trigger level in response to recent average noise levels.
- Still another factor might be that I chose to shield the ferrite-rod antennas, as discussed above.